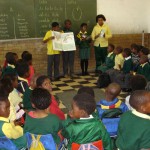
University attendance for black South Africans remains low, Statistics South Africa (Stats SA) said on Wednesday.
“Blacks don’t participate in universities to the same extent as whites and Indians. There’s just a too small number of blacks,” Statistician General Pali Lehohla said at the release of the 2013 General Household Survey (GHS).
Conducted by Stats SA between January and December 2013, the survey found that 73.5% of people aged 5 to 24 were attending educational institutions which is about the same as in 2002 when the attendance rate was 73.6%.
The survey estimates that 740 893 students were enrolled at higher education institutions in 2013. Of this, almost two-thirds (66.4%) of these students were black African while 22.3% were white; 6.7% were coloured and 4.7% were Indian (Asian).
“Even though most students were black African, the student participation rate of this population group remained proportionally low in comparison with the Indian (Asian) and white population,” noted the survey.
According to the survey, approximately 84.8% of students paid R4000 or more per year in tuition fees and 7% reportedly did not pay fees. Only 18% off students benefitted from bursaries or fee reductions.
The report found that the percentage of people aged 18 to 29 attending university by population group was at 3.2% in 2013 compared to 2.8% in 2002, while 3.1% of coloureds attended university. Additionally 18.7% of whites were attending university in 2013 while 9.2% of Indians (Asians) were attending university.
Meanwhile, the number of people aged 5 to 24 stated a lack a money for fees as the primary reason for not studying.
More than one-quarter (25.3%) of premature school leavers in this age group blamed ‘a lack of money’ for not studying. The comparable figure is as high as 44.9% in KwaZulu-Natal. The percentage of learners who reported that they paid no tuition fees increased from 0.4% in 2002 to 62.4% in 2013. Provinces with the highest proportion of non-payers [no fee schools] were Limpopo at 88.8% and the Eastern Cape at 73.5%.
When coming to corporal punishment, this was mostly experienced by learners in the Eastern Cape and KwaZulu-Natal. However the proportion of learners who experienced corporal punishment decreased from 16.7% in 2011 to 13.5% in 2013.
Social grants
The dependency on social grants has also increased with individuals that benefitted from grants increased from 12.7% in 2003 to 30.2% in 2013.
The percentage of households that received at least one grant increased from 29.9% to 45.5%.
Healthcare
The GHS also revealed that 69.9% of households went to public clinics and hospitals first when household members fell ill or got injured, while 24.2% of households indicated that they would go to private doctors.
A further 4.7% preferred private clinics or hospitals. The study found that 82.5% of households that attended public health-care facilities were either very satisfied or satisfied with the service they received compared to 98% of households that attended private health-care facilities.
Water and sanitation
Although 89.9% of South African households had access to piped water in 2013, only 77.5% of Limpopo households enjoyed such access. This however, represented an improvement over 2002 when only 73.9% of households in this province had access to piped water.
Nationally, 63.2% of households rated the quality of water-related services they received as ‘good’. This satisfaction has, however, been eroding steadily since 2005 when 76.4% of users rated the services as good.
Residents of the Free State, Mpumalanga and Eastern Cape have consistently been least satisfied with the quality of water.
Meanwhile, the percentage of households with no toilets or bucket toilets decreased from 12.3% in 2002 to 5.3% in 2013. Households in Eastern Cape (10%) Free State (7.7%) and Northern Cape (7.4%) were most likely to lack access to toilet facilities or to still use the bucket toilets.
Energy
The report found that countrywide, the use of wood and paraffin for cooking decreased consistently in most provinces between 2002 and 2013. “It is however notable that a relatively high percentage of households 44.9% in Limpopo and 23.9% of households in the Eastern Cape were still using wood and paraffin for cooking,” noted the report. – SAnews.gov.za


