


Traditional Authorities
Johannesburg – South Africa has 14.5 million people living under traditional authorities across the country, says Statistics South Africa.
Limpopo has the most, with about 59.2 percent of the people there living under tribal authorities. This was followed by Mpumalanga with 47.3 percent and Eastern Cape with 44.4 percent and KwaZulu-Natal with 43.7 percent.
The lowest population living under tribal authorities was found in Gauteng with only 0.9 percent, followed by Free State at 11 percent and the Northern Cape at 11.9 percent.
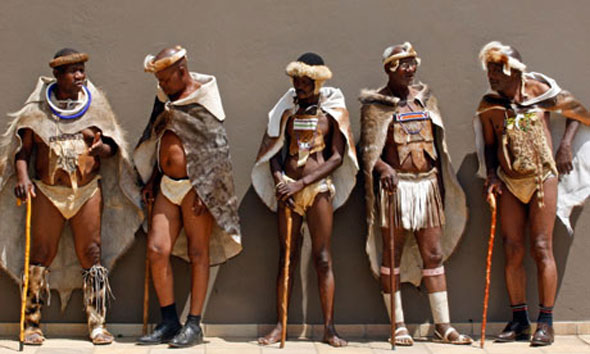
Traditional authorities’ areas are described as people living under traditional chiefs or amakhosi.
These statistics formed part of the 2011 Census results which were released today by Statistician General Pali Lehohla in Johannesburg.
Lehohla said StatsSA was launching results specifically focused on these areas because one of the major challenges in rural areas had been a lack of unique identification for structures that do not work effectively for service delivery.
“While in urban areas it appears to be easier to deliver small area statistics, our divided past make it more painstaking to deliver comprehensive rural statistics,” said Lehohla.
Released in October last year, the overall Census results showed that South Africa’s population had swelled to 51.7 million in 2011.
The stats on areas under traditional authorities revealed that formal dwellings were the most commonly found dwelling type in households living in traditional areas and was recorded at 69.3 percent.
A total of 24.5 percent lived in a traditional dwelling, compared to 7.9 percent nationally. More than half of households in traditional areas who lived in the traditional dwellings were in the Eastern Cape, with 59.6 percent.
The main source of energy at all the traditional authorities’ areas was electricity at 76.5 percent. The lowest proportions using electricity for lighting was Eastern Cape with 60 percent and KwaZulu-Natal with 64 percent.
In both the Eastern Cape and KwaZulu-Natal, candles were more prevalent for lighting.
About seven in 10 households or 75.4 percent had access to piped water. This is lower than the national average at 91.2 percent.
The percentage of households without any rubbish disposal facility was at 12.2 percent in tribal authority areas, which is far less than the national figure of 63.6 percent.
Lehohla hoped that these stats would help government and traditional leaders promote rural development, which is one of government’s priorities.
Meanwhile, working with Google, StatsSA revealed that the 2011 Population Census results and annual mid-year population estimates were now available on Google Public Data Explorer (PDE).
PDE is a platform designed to help people understand statistics and data through rich, interactive visualisations and it has already been used in Kenya.
Lehohla said the PDE would provide high value data that was easy to understand, locate, and use more timely.
Lehohla hoped that by making the results public, South Africans will have robust conversations about the country’s development. He added that it was also part of promoting citizens access to information in line with the principles of open government partnership.
There are different ways to use the census data on PDE. Data can be compared across provinces and municipalities using the four main categories available – demographics, education, households, and labour market.
For example, the unemployment rate across all South Africa’s nine provinces can be compared against the national average. People can also compare provinces and municipalities among others and they can choose to view it in different formats such as bars, line graphs maps or bubble charts.
People can go to Google and search for Public Data Explorer. Once there one can search for South Africa , then choose the type of data they want. – SAnews.gov.za
